Lataa esitys
Esittely latautuu. Ole hyvä ja odota

1
TU-91.1001 Läsnäoloharjoitukset 2 TALOUDELLINEN KASVU JA HYVINVOINTI

2
1. Taloudellisen kasvun edellytykset Suomessa: Suomen taloudellinen kilpailukyky on useana vuonna todettu kansainvälisissä tutkimuksissa varsin hyväksi. Mitä näissä tutkimuksissa mitataan?

3
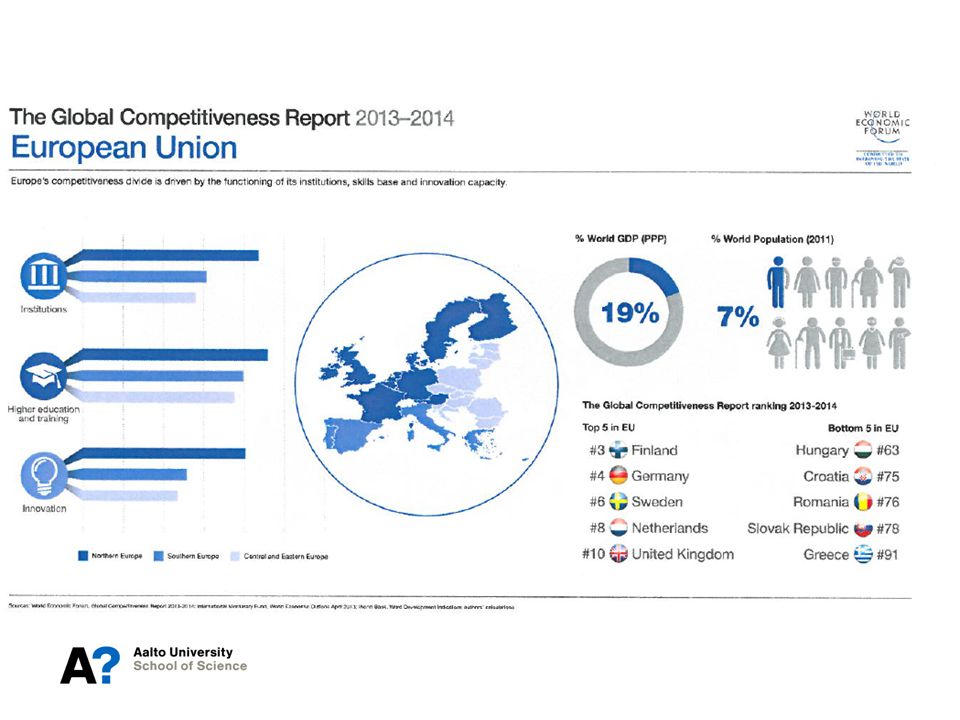
World Economic Forum Global Competitiveness Index

4
World Economic Forum Global Competitiveness Index
Mitä kilpailukykyindeksi mittaa? Maiden kykyä tarjota vaurautta Mikä puolestaan riippuu siitä, kuinka tuottavasti maa käyttää resurssejaan

5
Erilaisia pilareita, joille kilpailukykyindeksi perustuu:

7
SUOMI

8
SUOMEN ONGELMAKOHDAT:

9
MITEN SUOMI MENESTYY ERI MITTAREILLA?
Nämä indeksit perustuvat sekä “kovaan dataan” (1/3) että “haastatteludataan” (2/3).
 että haastatteludataan (2/3).")
10
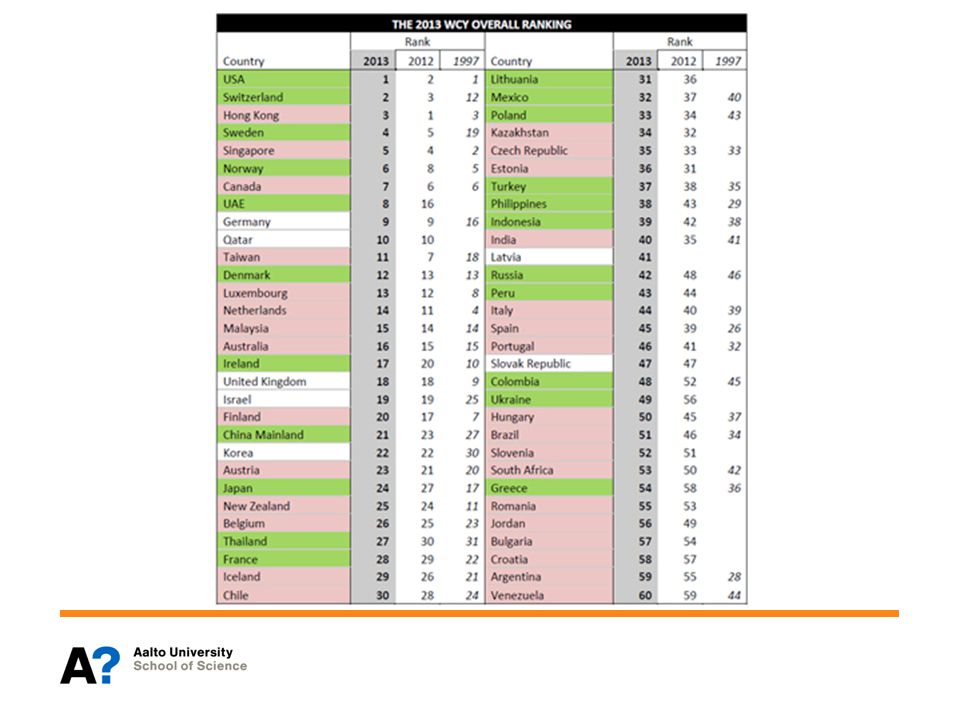
IMD:n kansainvälinen kilpailukyky tutkimus*
ECONOMIC PERFORMANCE Domestic Economy International Trade International Investment Employment Prices GOVERNMENT EFFICIENCY Public Finance Fiscal Policy Institutional Framework Business Legislation Societal Framework BUSINESS EFFICIENCY Productivity Labor Market Finance Management Practices Attitudes and Values INFRASTRUCTURE Basic Infrastructure Technological Infrastructure Scientific Infrastructure Health and Environment Education *yli 300 muuttujaa, 2/3 ”kovaa” dataa, 1/3 haastatteluista (vert, WEF)
")
12
The World Competitiveness Scoreboard 2013, IMD

13
Suomi eri indikaattoreilla

14
Kuinka voimme pärjätä kiristyvässä kilpailussa?
Innovaatiot, innovaatiot, innovaatiot! Panostettava koulutukseen ja tutkimukseen entistä enemmän!

15
2. Hyvinvointi ja onnellisuus: Perehdy muutamiin hyvinvointia/onnellisuutta mittaamaan kehitettyyn mittariin. Miten hyvin suomalaiset voivat? President Sarkozy is calling for a 'revolution' in the way economic growth is measured.

16
BKT ei mittaa hyvinvointia vaan tuotannon arvoa
Vaikka kasvu ei yksin tuo onnellisuutta, kasvun loppuminen tuo kovin varmasti onnettomuutta monelle!

17
BKT:n rinnalle kehitettyjä mittareita hyvinvoinnin kartoittamiseksi
Index of Sustainable Economic Welfare (ISEW, “kestävän taloudellisen hyvinvoinnin indeksi”) Genuine Progress Indicator (GPI, “aidon kehityksen indikaattori”) Gross National Happiness (GNH) eli bruttokansanonnellisuus (ja hyvinvointi) Human Developement Index Prosperity Index Report on the Measurement of Economic Performance and Social Progress (Stigliz, Sen & Fitoussi) GDP tables don't tell the whole story – we need to measure our 'joie de vivre'
 Genuine Progress Indicator (GPI, aidon kehityksen indikaattori ) Gross National Happiness (GNH) eli bruttokansanonnellisuus (ja hyvinvointi) Human Developement Index. Prosperity Index. Report on the Measurement of Economic Performance and Social Progress (Stigliz, Sen & Fitoussi) GDP tables don t tell the whole story – we need to measure our joie de vivre")
18
Suomen BKT:n, GPI:n ja ISEW:in kehitys vuosina 1945–2009 asukasta kohti vuoden 2000 hinnoin.
GPI = Genuine Progress Indicator; ISEW = Index of Sustainable Economic Welfare Lähde: Hoffrén 2011.

19
GPI:n laskentakaava voidaan esittää yksinkertaistettuna seuraavasti:
GPI = A + B - C - D + I A = tulonjaolla painotettu yksityinen kulutus B = hyvinvointia tuottavien markkinattomien palveluiden arvo C = yksityiset, tuotannon haitoista aiheutuvat menot D = luonnon heikentymisestä ja luonnonvarojen kulumisesta aiheutuvat kustannukset I = pääomakannan kasvu ja kansainvälisen kaupan tasapaino

21
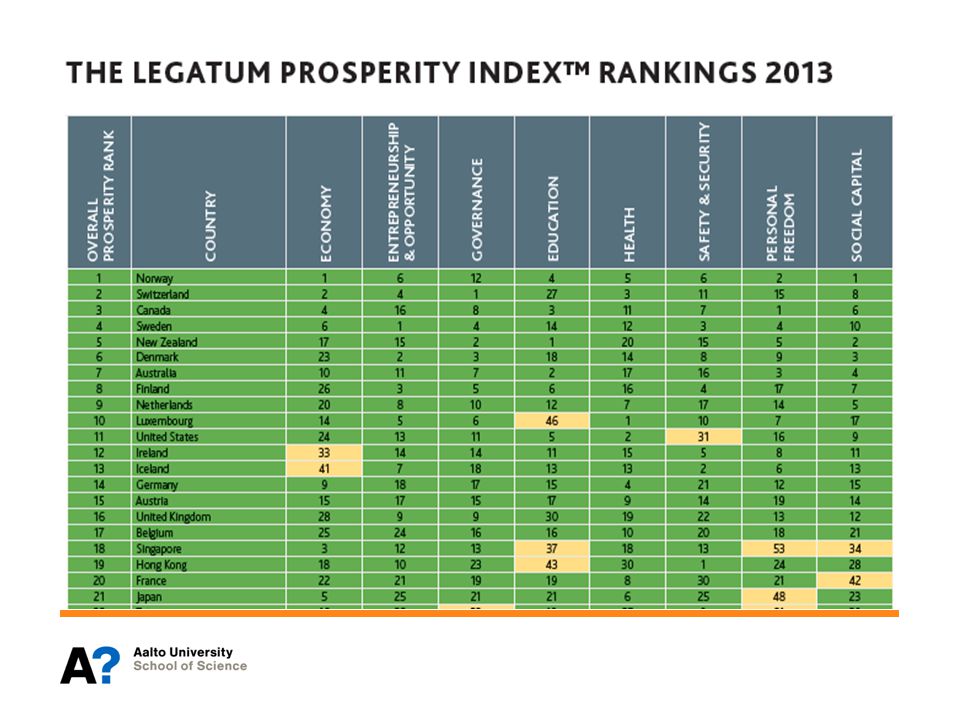
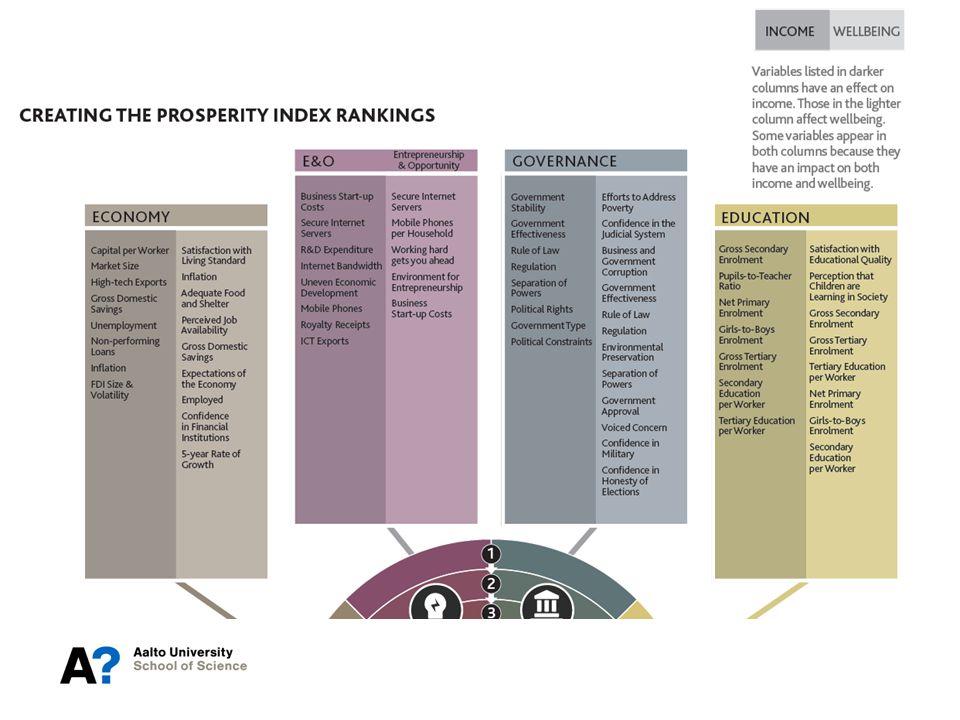
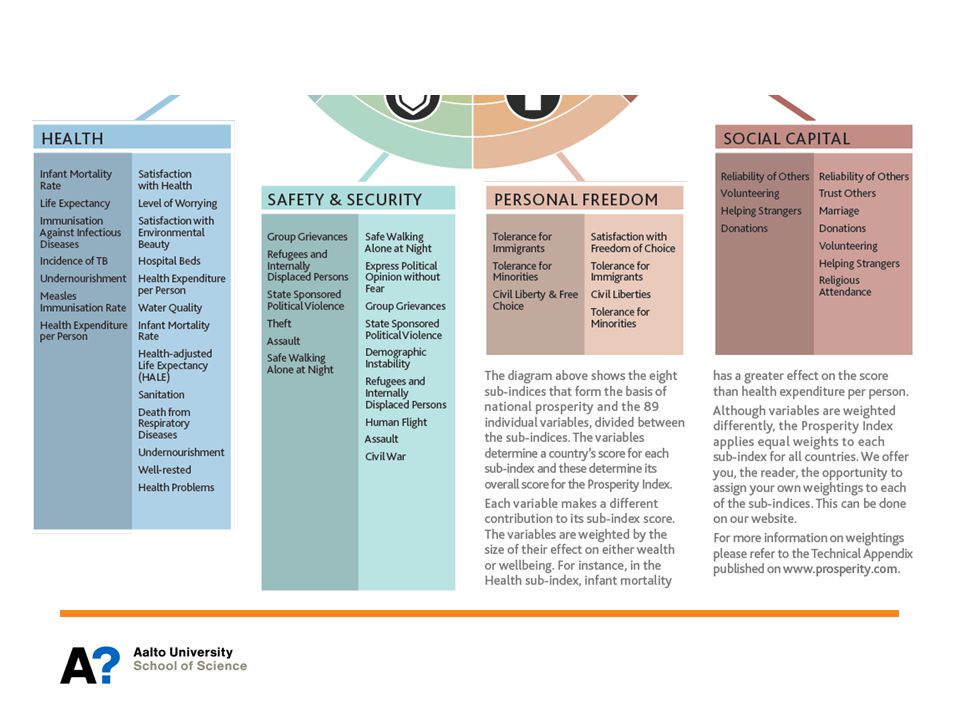
The foundations of prosperity that define successful nations include:
Economic Fundamentals – a growing, sound economy that provides opportunities for wealth creation Entrepreneurship and Innovation – an environment friendly to new enterprises and the commercialization of new ideas Education – an accessible, high-quality educational system that fosters human development Governance – an honest and effective government that preserves order and encourages productive citizenship Health – the physical well-being of the populace Personal Freedom – the degree to which individuals can choose the course of their lives Security – a safe environment in which people can pursue opportunity Social Capital – trustworthiness in relationships and strong communities

24
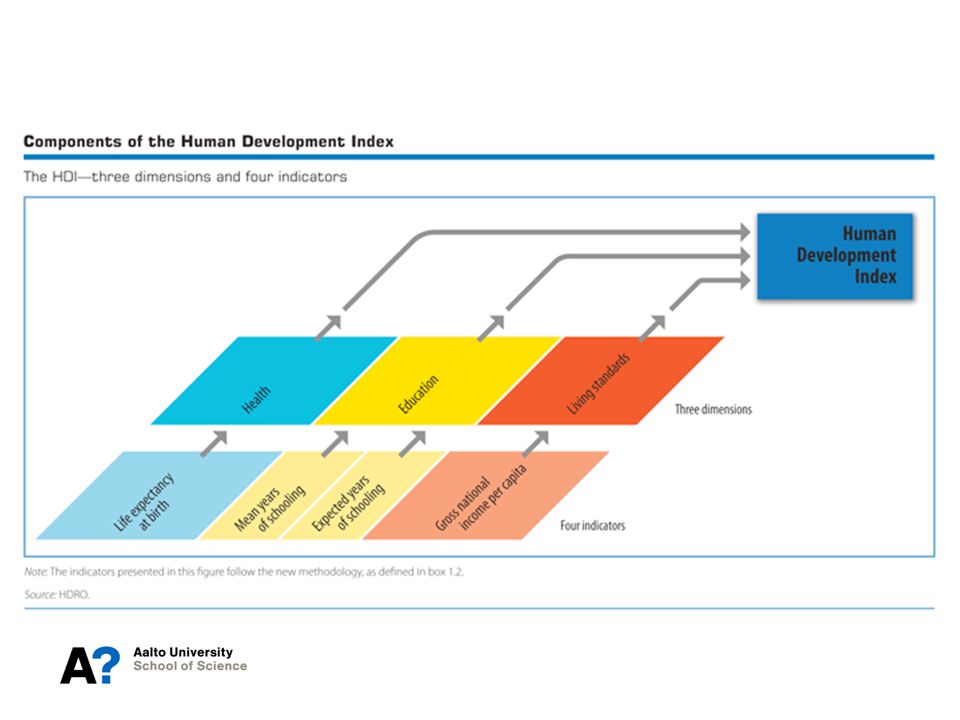
Human Development Index by UN
Norway 0.955 Austria 0.895 Australia 0.938 Singapore 0.895 United States 0.937 France 0.893 Netherlands 0.921 Finland 0.892 Germany 0.920 Slovenia 0.892 New Zealand 0.919 Spain 0.885 Ireland 0.916 Liechtenstein 0.883 Sweden 0.916 Italy 0.881 Switzerland 0.913 Luxembourg 0.875 Japan 0.912 United Kingdom 0.875 Canada 0.911 Czech Republic 0.873 South Korea 0.909 Greece 0.860 Hong Kong 0.906 Brunei 0.855 Iceland 0.906 Cyprus 0.848 Denmark 0.901 Malta 0.847 Israel 0.900 Belgium 0.897

26
Adjusting the HDI for inequalities
The IHDI is the HDI adjusted for inequalities in the distribution of achievements in each of the three dimensions of the HDI (health, education and income) The difference between the HDI and the IHDI represents the ‘loss’ in potential human development due to inequality. In 2012 the IHDI was calculated for 132 countries and the results are telling. For example, United States suffers a loss when its HDI value is adjusted for inequalities and moves 13 places down in rank.
 The difference between the HDI and the IHDI represents the ‘loss’ in potential human development due to inequality. In 2012 the IHDI was calculated for 132 countries and the results are telling. For example, United States suffers a loss when its HDI value is adjusted for inequalities and moves 13 places down in rank.")
27
The Inequality-adjusted Human Development Index (IHDI)
Norway 0.894 Czech Republic 0.826 Australia 0.864 Belgium 0.825 Sweden 0.859 United States 0.821 Netherlands 0.857 Luxembourg 0.813 Germany 0.856 France 0.812 Ireland 0.850 United Kingdom 0.802 Switzerland 0.849 Spain 0.796 Iceland 0.848 Israel 0.790 Denmark 0.845 Slovakia 0.788 Slovenia 0.840 Malta 0.778 Finland 0.839 Italy 0.776 Austria 0.837 Canada 0.832

Samankaltaiset esitykset


>")


