Lataa esitys
Esittely latautuu. Ole hyvä ja odota

1
Fossiiliset polttoaineet ja terveys
Juha Pekkanen,prof Kansanterveyslaitos Kuopion yliopisto

2
Suomen energiantuotanto (mtoe)
Maakaasu Öljy Hiili

3
Fossiiliset polttoaineet ja terveys
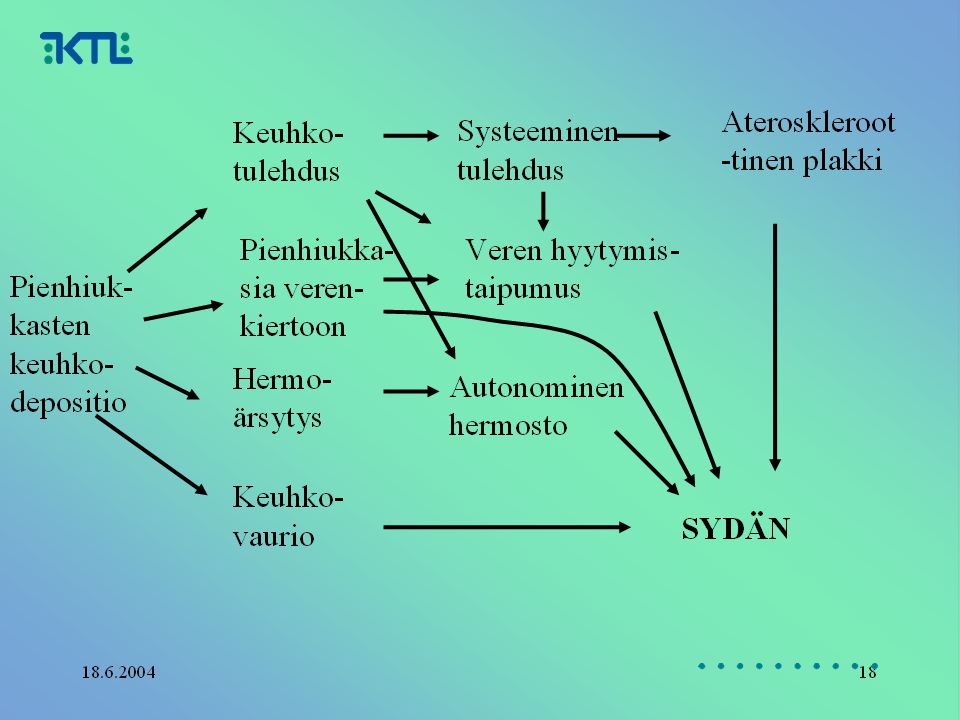
Pienhiukkaspäästöt -välittömät terveysvaikutukset -hillitsevä vaikutus kasvihuoneilmiöön Hiilidioksidipäästöt -kasvihuoneilmiö Keinot vähentää fossiilisten polttoaineiden käyttöä -vaikeita valintoja

4
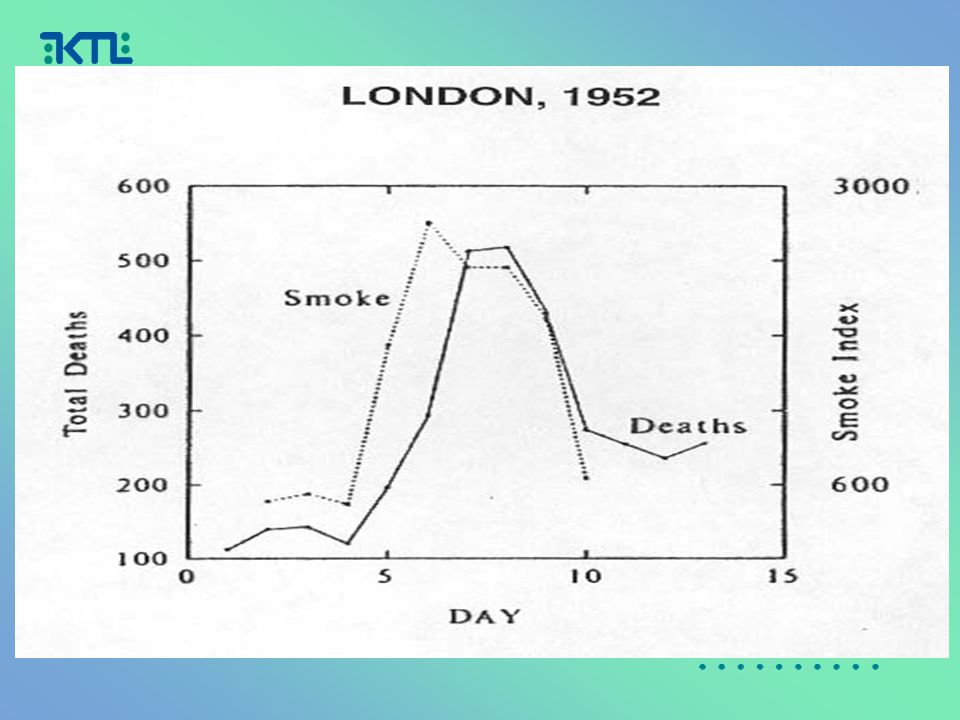
Kaupunki-ilman pienhiukkaset ja terveys
Lyhytaikaiset (päivittäinen vaihtelu) ärsytysoireet, keuhkofunktiot, kroonisten sairauksien pahentuminen, sairaalahoidot (astma, COPD, sepelvaltimotauti), kuolleisuus Pitkäaikaiset (uudet tautitapaukset) syöpä, sydän- ja hengityselinkuolleisuus N kuolemaa/v. Suomessa Epäsuorat (ilmastonmuutos)
 ärsytysoireet, keuhkofunktiot, kroonisten sairauksien pahentuminen, sairaalahoidot (astma, COPD, sepelvaltimotauti), kuolleisuus. Pitkäaikaiset (uudet tautitapaukset) syöpä, sydän- ja hengityselinkuolleisuus. N kuolemaa/v. Suomessa. Epäsuorat (ilmastonmuutos)")
7
problems (confounding by city, threshold ?)
")
8
Hiilikielto Dublinissa 1990 -Black Smoke laski 70%
-Sydän- ja verisuonitautikuol-leisuus laski 10% -Hengitystiekuol-leisuus laski 16% Clancy ym. 2002

10
PM2.5 komponentit ja terveys
Epidemiologia Toksikologia PM2.5 ++ sulfaatit + _ metallit diesel mineraalit +/_ puunpoltto ultrafine PM

11
Ilmastonmuutoksessa päästöt voimistavat kasvihuoneilmiötä
ilmasto.org 2

12
Maapallon lämpötilan muutos
Tällä hetkellä lämpötila noussut noin 0.6 astetta verrattuna esiteolliseen aikaan Global average temperature is projected to rise by 1.4 to 5.8 °C from 1990 to 2100. IPCC:n arvion mukaan lämpötila maailmassa nousee ilmastonmuutoksen vaikutuksesta 1,4–5,8 ºC vuoteen 2100 mennessä. Suomessa ilmatieteenlaitos on arvioinut lämpötilan muutokseksi 1,1-6,6 ºC samassa ajassa. · Arktisten alueiden lämpenemisen vaikutuksia koskevassa tuoreessa ACIA-raportissa esitetään arktisten alueiden lämpenevän jopa tuplasti nopeammin kuin muun maapallon keskimäärin, eli siis lämpötilan nousuksi vuoteen 2100 mennessä esitetään 4-7 astetta. Lisätietoja · Sadan vuoden kuluttua Oulussa voi olla Helsingin ilmasto. McMichael 2003

13
McMichael 2003

14
Kasvihuonekaasujen vaikutukset (%) ja viipymät ilmakehässä
Yhdiste pitoisuus vaikutus viipymäaika ilmakehässä ilmastonmuu- ilmakehässä (ppm) tokseen (%) CO a CFC 0, a CH4 1, a N2O 0, a tropsf. O3 0, d muut
 tokseen (%) CO a. CFC 0, a. CH4 1, a. N2O 0, a. tropsf. O3 0, d. muut 2-5.")
15
Hiilidioksidipäästöt Suomessa
teollisuuden prosessit 4 % jätehuolto 4 % maatalous 9 % liikenne 17 % yksityisautoilu teollisuuden ja kaupan kuljetukset julkinen liikenne energiantuotanto 66 % teollisuuteen kotitalouksien sähkön- kulutukseen ja lämmitykseen palvelusektorille Maapallon tasolla maankäyttö (metsien hävittäminen) aiheuttaa 18% päästöistä ilmasto.org 13 Lähde: Tilastokeskus 2003
 aiheuttaa 18% päästöistä. ilmasto.org. 13. Lähde: Tilastokeskus")
16
Ilmastonmuutoksen ennustaminen
Lämpötilan riippuvuus kasvihuonekaasuista monimutkainen Systeemi jää-lumi Pilvet Meri-ilmakehä prosessit ilmakehä ilmakehä ilmakehä lämpenee lämpenee lämpenee lumi ja jää haihtuminen meren lämpö- vähenee lisääntyy tila nousee albedo pilvipeite meri luovut- pienenee lisääntyy taa enemmän CO2 voimakas ilmakehän ilmakehän lämp. albedo CO2 kasvaa lisääntyy jäähtyminen lämpeneminen takaisin- positiivinen negatiivinen positiivinen kytkentä (vahvistus) (heikennys) (vahvistus)
 (heikennys) (vahvistus)")
17
Ilman epäpuhtauskomponenttien vaikutus (IPCC 2001)
")
18
Kasvihuonekaasujen kehittymiseen vaikuttavia tekijöitä
Väestön kasvu Talouden kehitys Energian kulutus ja tuotantotavat Päästöjen rajoitustekniikat Maankäytön muutokset Maanviljelyn päästöjen muodostuminen

19
Välijohtopäätös Onko lämpenemistä tapahtunut?
-Tilastolliset perustelut epävarmat -Fysikaaliset perustelut vakuuttavat Arrhenius (1890): fossiilisten polttoaineiden käyttö lisää CO2-pitoisuuden noin 2-kertaiseksi ja maapallon lämpötila nousee 5-6 ºC Ihmisen toiminnalla merkittävä osuus lämpenemisessä Tulevan ennustaminen erittäin epävarmaa
: fossiilisten polttoaineiden käyttö lisää CO2-pitoisuuden noin 2-kertaiseksi ja maapallon lämpötila nousee 5-6 ºC. Ihmisen toiminnalla merkittävä osuus lämpenemisessä. Tulevan ennustaminen erittäin epävarmaa.")
20
Keskeiset vaikutukset
Jäätiköiden sulaminen (tulvat, vesihuolto) Viljasatojen heikentyminen (erit. Afrikka) Meren happamoituminen (kalansaaliit) Merenpinnan nousu, äärimmäiset sääilmiöt, helleaallot Infektiotaudit Pakolaisuus, aliravitsemus Biodiversiteetti Odottamattomat isot muutokset muuutokset monsuuneissa, El Nino napajäätiköiden romahdus Suuret epävarmuudet Viljasadot ensin (2-3 asteen nousu) paranevat lauhealla vyöhykkeellä, sitten vähenevät 2 asteen nousu voi johtaa 15-40% lajien tuhoon
 Viljasatojen heikentyminen (erit. Afrikka) Meren happamoituminen (kalansaaliit) Merenpinnan nousu, äärimmäiset sääilmiöt, helleaallot. Infektiotaudit. Pakolaisuus, aliravitsemus. Biodiversiteetti. Odottamattomat isot muutokset. muuutokset monsuuneissa, El Nino. napajäätiköiden romahdus. Suuret epävarmuudet. Viljasadot ensin (2-3 asteen nousu) paranevat lauhealla vyöhykkeellä, sitten vähenevät. 2 asteen nousu voi johtaa 15-40% lajien tuhoon.")
21
Elintarviketuotanto Kuivuuden aiheuttama sadon väheneminen
Kasvuolosuhteiden siirtyminen eri paikkaan Muutaman prosentin negatiivinen vaikutus Suurin ongelma alueellisesti (esim. Sahelin alue, pääosin kärsivät kehitysmaat) Seuraus pakolaisuus, siirtolaisuus, epäsuorat terveysvaikutukset, sodat ja rauhattomuus
 Seuraus pakolaisuus, siirtolaisuus, epäsuorat terveysvaikutukset, sodat ja rauhattomuus.")
22
Muutokset viljantuotannossa - 3°C nousu (3 eri ilmastomallin mukaan)
Note: Percent changes in production are relative to what they would be in a future with no climate change. Overall changes are relatively robust to different model outputs, but regional patterns differ depending on the model’s rainfall patterns – more details in Fischer et al. (2005). The work assumed mostly farm-level adaptation in developing countries but some economy-wide adaptation in developed countries. The work also assumed a strong carbon fertilisation effect - 15 – 25% increase in yield for a doubling of carbon dioxide levels for responsive crops (wheat, rice, soybean) and a 5 – 10% increase for non-responsive crops (maize). These are about twice as high as the latest field-based studies suggest – see Box 3.4 for more detail. Lisäksi muutoksien tärkeiden lajien (pölyttäjät etc) levinneisyys, tulvat, metsä- ja peltopalot, tuhohyönteiset, alailmakehän otsosipitoisuuden kasvu (foss. Poltto) Meriveden happamuus – kalakantojen kärsiminen Until recently, research suggested that the positive benefits of increasing carbon dioxide concentrations might compensate for the negative effects of rising mean temperatures (namely shorter growing season and reduced yields). Koko maapallo Kehitty-neet maat Kehitys-maat Stern 2006
. The work assumed mostly farm-level adaptation in developing countries but some economy-wide adaptation in developed countries. The work also assumed a strong carbon fertilisation effect - 15 – 25% increase in yield for a doubling of carbon dioxide levels for responsive crops (wheat, rice, soybean) and a 5 – 10% increase for non-responsive crops (maize). These are about twice as high as the latest field-based studies suggest – see Box 3.4 for more detail. Lisäksi muutoksien tärkeiden lajien (pölyttäjät etc) levinneisyys, tulvat, metsä- ja peltopalot, tuhohyönteiset, alailmakehän otsosipitoisuuden kasvu (foss. Poltto) Meriveden happamuus – kalakantojen kärsiminen. Until recently, research suggested that the positive benefits of increasing carbon dioxide concentrations might compensate for the negative effects of rising mean temperatures (namely shorter growing season and reduced yields). Koko maapallo. Kehitty-neet maat. Kehitys-maat. Stern")
23
Lisäväestö (miljoonia), joka altiina rannikon myrskytulville
Notes: Figure shows increase in number of people flooded by storm surge on average each year in the 2080s for different levels of global temperature rise (relative to pre-industrial levels). Results assume that flood defences are upgraded in phase with GDP per capita, but ignoring sea level rise itself. Lines represent different socio-economic futures for the 2080s based on a range of population and growth paths taken from the IPCC: green – A1/B1 low population (7 billion), red – B2 medium population (10 billion), blue – A2 high population (15 billion) (details of population and GDP per capita for each scenario set out in Box 3.2). A richer more populous country will be able to spend more on flood defences, but will have a greater number of people at risk. The impacts are shown for the “transient sea level rise” associated with reaching a particular level of warming, but do not include the consequences of the additional sea level rise that the world would be committed to for a given level of warming (0 – 15 cm for 1°C, 10 – 30 cm for 2°C, 20 – 50 cm for 3°C, 35 – 80 cm for 4°C; more details in Chapter 1). The ranges cover the uncertainties in climate modelling and how much sea level rises for a given change in temperature (based on IPCC Third Assessment Report data from 2001, which may be revised in the Fourth Assessment due in 2007). Maapallon lämpötilan nousu (oC) Stern 2006
. Results assume that flood defences are upgraded in phase with GDP per capita, but ignoring sea level rise itself. Lines represent different socio-economic futures for the 2080s based on a range of population and growth paths taken from the IPCC: green – A1/B1 low population (7 billion), red – B2 medium population (10 billion), blue – A2 high population (15 billion) (details of population and GDP per capita for each scenario set out in Box 3.2). A richer more populous country will be able to spend more on flood defences, but will have a greater number of people at risk. The impacts are shown for the transient sea level rise associated with reaching a particular level of warming, but do not include the consequences of the additional sea level rise that the world would be committed to for a given level of warming (0 – 15 cm for 1°C, 10 – 30 cm for 2°C, 20 – 50 cm for 3°C, 35 – 80 cm for 4°C; more details in Chapter 1). The ranges cover the uncertainties in climate modelling and how much sea level rises for a given change in temperature (based on IPCC Third Assessment Report data from 2001, which may be revised in the Fourth Assessment due in 2007). Maapallon lämpötilan nousu (oC) Stern")
24
Tartuntatautien lisääntyminen
Pääasiassa vektoritautien lisääntyminen, kun olosuhteet muuttuvat edullisemmiksi vektorille (esim. malariahyttysen levinneisyys) Jossain määrin lämpenemisen aiheuttama suora vaikutus (esim. koleravibrion säilyminen rehevöityneissä lämpimissä vesissä)
 Jossain määrin lämpenemisen aiheuttama suora vaikutus (esim. koleravibrion säilyminen rehevöityneissä lämpimissä vesissä)")
25
Vektoritautien lisääntyminen

26
WHO arvio terveysvaikutuksista
Nykyään vuosittain kuolemaa -pääosin ripuli, malaria, aliravitsemus Yhden asteen lämpötilan nousu esiteollisista ajoista nostaisi määrän kuolemaan Suurempi nousu lisää määrää hyvin nopeasti -3 oC nousu aiheuttanee 1-3 miljoonaa lisäkuolemaa aliravitsemukseen

27
WHO arvio lisäkuolemista (miljoonaa ihmistä kohti) v. 2000
Pääosin ripuli, malaria, aliravitsemus. The World Health Organisation (WHO) estimates that climate change since the 1970s is already responsible for over 150,000 deaths each year through increasing incidence of diarrhoea, malaria and malnutrition, predominantly in Africa and other developing regions (Figure 3.8).50 Just a 1°C increase in global temperature above pre-industrial could double annual deaths from climate change to at least 300,000 according to the WHO.51 These figures do not account for any reductions in cold-related deaths, which could be substantial.52 At higher temperatures, death rates will increase sharply, for example millions more people dying from malnutrition each year.53 Climate change will also affect health via other diseases not included in the WHO modelling.54 The distribution and abundance of disease vectors are closely linked to temperature and rainfall patterns, and will therefore be very sensitive to changes in regional climate in a warmer world. Changes to mosquito distributions and abundance will have profound impacts on malaria prevalence in affected areas. 50 Based on detailed analysis by McMichael et al. (2004), using existing quantitative studies of climate-health relationships and the UK Hadley Centre GCM (business as usual emissions) to estimate relative changes in a range of climate-sensitive outcomes, including diarrhoea, malaria, dengue fever and malnutrition. Changes in heat- and cold-related deaths were not included in the aggregate estimates of mortality. Climate change contributes 2% to today’s climate disease burden (6.8 million deaths annually) and 0.3% to today’s total global disease burden. 51 Projections from Patz et al. (2005) 52 See, for example, Tol (2002) and Bosello et al. (2006) 53 As described earlier, today 800 million people are at risk of hunger and around 4 million of those die from malnutrition each year. Once temperatures increase by 3°C, million additional people could be at risk (with little carbon fertilisation effect), suggesting 1 – 3 million more dying each year from malnutrition, assuming that the ratio of risk of hunger to mortality from malnutrition remains the same. This ratio will of course change with income status – see Chapter 4 for more detail. 54 The impacts on human development mediated through changes in income are explored in Chapter 4. Stern 2006
 estimates that climate change since the 1970s is already responsible for over 150,000 deaths each year through increasing incidence of diarrhoea, malaria and malnutrition, predominantly in Africa and other developing regions (Figure 3.8).50 Just a 1°C increase in global temperature above pre-industrial could double annual deaths from climate change to at least 300,000 according to the WHO.51 These figures do not account for any reductions in cold-related deaths, which could be substantial.52 At higher temperatures, death rates will increase sharply, for example millions more people dying from malnutrition each year.53 Climate change will also affect health via other diseases not included in the WHO modelling.54. The distribution and abundance of disease vectors are closely linked to temperature and rainfall patterns, and will therefore be very sensitive to changes in regional climate in a warmer world. Changes to mosquito distributions and abundance will have profound impacts on malaria prevalence in affected areas. 50 Based on detailed analysis by McMichael et al. (2004), using existing quantitative studies of climate-health relationships and the UK Hadley Centre GCM (business as usual emissions) to estimate relative changes in a range of climate-sensitive outcomes, including diarrhoea, malaria, dengue fever and malnutrition. Changes in heat- and cold-related deaths were not included in the aggregate estimates of mortality. Climate change contributes 2% to today’s climate disease burden (6.8 million deaths annually) and 0.3% to today’s total global disease burden. 51 Projections from Patz et al. (2005) 52 See, for example, Tol (2002) and Bosello et al. (2006) 53 As described earlier, today 800 million people are at risk of hunger and around 4 million of those die from malnutrition each year. Once temperatures increase by 3°C, million additional people could be at risk (with little carbon fertilisation effect), suggesting 1 – 3 million more dying each year from malnutrition, assuming that the ratio of risk of hunger to mortality from malnutrition remains the same. This ratio will of course change with income status – see Chapter 4 for more detail. 54 The impacts on human development mediated through changes in income are explored in Chapter 4. Stern")
28
Välijohtopäätös Fossiilisiin polttoaineisiin perustuvasta taloudesta päästävä eroon -pienhiukkaset,kasvihuoneilmiö,ei-kestävä Paljon hankalia valintoja, kuten Biopolttoaineet (pienpoltto vs keskitetty poltto) Ydinvoima Liikenne Oikeudenmukaisuus
 Ydinvoima. Liikenne. Oikeudenmukaisuus.")
29
Suomen energiantuotanto (mtoe)
Maakaasu Öljy Hiili

30
Mitä vaihtoehtoja? ’markkinavoimat ratkaisee’ itsestään päästökauppa
’teknologia ratkaisee’ energiatehokkuus puhtaampi poltto CO2 talteenotto,metaanipäästöt ym. uusiutuvat energiamuodot Verot, päästörajoitukset Kulutustottumukset voiko luottaa, että ihmiset tulee järkiinsä? (Pääsiäissaaret)
")
31
Stern review 2006: Taloudelliset seuraamukset
BAU skenaario johtaa maapallon kansantuotteen laskuun 5-20%:lla Vaihtoehto: kasvihuonekaasujen vakauttaminen tasolle 550 ppm CO2e Kustannukset noin 1% kansantuotteen lasku Analyysi seur 200 v In summary, analyses that take into account the full ranges of both impacts and possible outcomes - that is, that employ the basic economics of risk - suggest that BAU climate change will reduce welfare by an amount equivalent to a reduction in consumption per head of between 5 and 20%. Taking account of the increasing scientific evidence of greater risks, of aversion to the possibilities of catastrophe, and of a broader approach to the consequences than implied by narrow output measures, the appropriate estimate is likely to be in the upper part of this range. This Review has focused on the feasibility and costs of stabilisation of greenhouse gas concentrations in the atmosphere in the range of ppm CO2e. Stabilising at or below 550ppm CO2e (johtaa noin 3 asteen lämpötilan nousuun) would require global emissions to peak in the next years, and then fall at a rate of at least 1 - 3% per year. The range of paths is illustrated in Figure 3. By 2050, global emissions would need to be around 25% below current levels. These cuts will have to be made in the context of a world economy in 2050 that may be times larger than today - so emissions per unit of GDP would need to be just one quarter of current levels by 2050. Achieving these deep cuts in emissions will have a cost. The Review estimates the annual costs of stabilisation at ppm CO2e to be around 1% of GDP by a level that is significant but manageable
 would require global emissions to peak in the. next years, and then fall at a rate of at least 1 - 3% per year. The range of. paths is illustrated in Figure 3. By 2050, global emissions would need to be around. 25% below current levels. These cuts will have to be made in the context of a world. economy in 2050 that may be times larger than today - so emissions per unit of. GDP would need to be just one quarter of current levels by Achieving these deep cuts in emissions will have a cost. The Review estimates. the annual costs of stabilisation at ppm CO2e to be around 1% of GDP. by a level that is significant but manageable.")
32
Ilmakehän vakauttaminen 550ppm CO2e: emissio ‘polkuja’
Figure 3 Illustrative emissions paths to stabilise at 550ppm CO2e. The figure below shows six illustrative paths to stabilisation at 550ppm CO2e. The rates of emissions cuts given in the legend are the maximum 10-year average rate of decline of global emissions. The figure shows that delaying emissions cuts (shifting the peak to the right) means that emissions must be reduced more rapidly to achieve the same stabilisation goal. The rate of emissions cuts is also very sensitive to the height of the peak. For example, if emissions peak at 48 GtCO2 rather than 52 GtCO2 in 2020, the rate of cuts is reduced from 2.5%/yr to 1.5%/yr. Stern 2006
 means that emissions must be. reduced more rapidly to achieve the same stabilisation goal. The rate of emissions cuts is also very. sensitive to the height of the peak. For example, if emissions peak at 48 GtCO2 rather than 52 GtCO2 in. 2020, the rate of cuts is reduced from 2.5%/yr to 1.5%/yr. Stern")
33
Keskeiset toimenpiteet (Stern 2006)
Hinta päästöille Suoraan - verotus, päästökauppa Epäsuorasti – päästörajoitukset 10-20 vuodessa osaksi kaikkea toimintaa Uusi teknologia (matala päästö, tehokas) Tutkimuksen ja uusien teknologioiden tuki Käyttäytymismuutosten helpottaminen Standardit, informointi Kaikkia tarvitaan nyt! Policy to reduce emissions should be based on three essential elements: carbon pricing, technology policy, and removal of barriers to behavioural change.
 Tutkimuksen ja uusien teknologioiden tuki. Käyttäytymismuutosten helpottaminen. Standardit, informointi. Kaikkia tarvitaan nyt! Policy to reduce emissions should be based on three essential elements: carbon pricing, technology policy, and removal of barriers to behavioural. change.")
34
Muut toimenpiteet (Stern 2006)
Paikallinen sopeutuminen Kansainvälinen yhteistyö Vapaamatkustajat Yhtenäinen hinta päästöille Kehitysmaiden tukeminen Sopeutuminen Uusi teknologia Tutkimus ja tuotekehitys Climate change mitigation raises the classic problem of the provision of a global public good. It shares key characteristics with other environmental challenges that require the international management of common resources to avoid free riding. Research carried out for this report indicates that the opportunity cost of forest protection in 8 countries responsible for 70 per cent of emissions from land use could be around $5 billion per annum initially, although over time marginal costs would rise.

35
Keskeiset keinot (Stern 2006)
Energiantuotanto (yli 50% päästöistä, kasvaa) energiatehokkuus vähäpäästöiset energiamuodot Silti v yli 50% energiasta tuotetaan öljyllä CO2 talteenotto Metsien tuhoaminen (18% päästöistä) vähennys 70%:lla maksaisi 5 mrd €/v. Liikenne (14% päästöistä, kasvaa) vaikea lyhyellä tähtäimellä Increasing scarcity of fossil fuels alone will not stop emissions growth in time. The stocks of hydrocarbons that are profitable to extract (under current policies) are more than enough to take the world to levels of CO2 concentrations well beyond 750ppm, with very dangerous consequences for climate-change impacts. exhausted. Studies by the International Energy Agency show that, by 2050, energy efficiency has the potential to be the biggest single source of emissions savings in the energy sector. Non-energy emissions make up one-third of total greenhouse-gas emissions; action here will make an important contribution. Large-scale uptake of a range of clean power, heat, and transport technologies is required for radical emission cuts in the medium to long term. The power sector around the world will have to be least 60%, and perhaps as much as 75%, decarbonised by 2050 to stabilise at or below 550ppm CO2e. Deep cuts in the transport sector are likely to be more difficult in the shorter term, but will ultimately be needed. While many of the technologies to achieve this already exist, the priority is to bring down their costs so that they are competitive with fossil-fuel alternatives under a carbon-pricing policy regime. The shift to a low-carbon global economy will take place against the background of an abundant supply of fossil fuels. That is to say, the stocks of hydrocarbons that are profitable to extract (under current policies) are more than enough to take the world to levels of greenhouse-gas concentrations well beyond 750ppm CO2e, with very dangerous consequences. Indeed, under BAU, energy users are likely to switch towards more carbon-intensive coal and oil shales, increasing rates of emissions growth. Even with very strong expansion of the use of renewable energy and other lowcarbon energy sources, hydrocarbons may still make over half of global energy supply in Extensive carbon capture and storage would allow this continued use of fossil fuels without damage to the atmosphere, and also guard against the danger of strong climate-change policy being undermined at some stage by falls in fossil-fuel prices. Estimates based on the likely costs of these methods of emissions reduction show that the annual costs of stabilising at around 550ppm CO2e are likely to be around 1% of global GDP by 2050, with a range from –1% (net gains) to +3.5% of GDP.
 energiatehokkuus. vähäpäästöiset energiamuodot. Silti v yli 50% energiasta tuotetaan öljyllä. CO2 talteenotto. Metsien tuhoaminen (18% päästöistä) vähennys 70%:lla maksaisi 5 mrd €/v. Liikenne (14% päästöistä, kasvaa) vaikea lyhyellä tähtäimellä. Increasing scarcity of fossil fuels alone will not stop emissions growth in time. The stocks. of hydrocarbons that are profitable to extract (under current policies) are more than. enough to take the world to levels of CO2 concentrations well beyond 750ppm, with very. dangerous consequences for climate-change impacts. exhausted. Studies by the International Energy Agency show that, by 2050, energy. efficiency has the potential to be the biggest single source of emissions savings in. the energy sector. Non-energy emissions make up one-third of total greenhouse-gas emissions; action. here will make an important contribution. Large-scale uptake of a range of clean power, heat, and transport technologies is. required for radical emission cuts in the medium to long term. The power sector. around the world will have to be least 60%, and perhaps as much as 75%, decarbonised by 2050 to stabilise at or below 550ppm CO2e. Deep cuts in the. transport sector are likely to be more difficult in the shorter term, but will ultimately be. needed. While many of the technologies to achieve this already exist, the priority is to. bring down their costs so that they are competitive with fossil-fuel alternatives under. a carbon-pricing policy regime. The shift to a low-carbon global economy will take place against the background of. an abundant supply of fossil fuels. That is to say, the stocks of hydrocarbons that are. profitable to extract (under current policies) are more than enough to take the world. to levels of greenhouse-gas concentrations well beyond 750ppm CO2e, with very. dangerous consequences. Indeed, under BAU, energy users are likely to switch. towards more carbon-intensive coal and oil shales, increasing rates of emissions. growth. Even with very strong expansion of the use of renewable energy and other lowcarbon. energy sources, hydrocarbons may still make over half of global energy. supply in Extensive carbon capture and storage would allow this continued. use of fossil fuels without damage to the atmosphere, and also guard against the. danger of strong climate-change policy being undermined at some stage by falls in. fossil-fuel prices. Estimates based on the likely costs of these methods of emissions reduction show. that the annual costs of stabilising at around 550ppm CO2e are likely to be around. 1% of global GDP by 2050, with a range from –1% (net gains) to +3.5% of GDP.")
36
Uusiutuvilla energiamuodoilla tuotetaan alle neljäsosa Suomen kokonaisenergiantarpeesta
Lähde: Tilastokeskus 2003 ilmasto.org 16

37
Tyypillisiä hiukkaspäästökertoimia eri energiantuotantolaitoksissa.

38
Ydinvoima Säteilysuojelussa erilaiset standardit kuin ‘perinteisissä’ ilmansaasteissa Pienhiukkaset 1300 kuolemaa/v. Ydinjätteiden loppusijoitus ‘ei terveyttä vaarantavia säteilyhaittoja’ ~3 miljardia €, 10% lisähinta sähköön Miten painotetaan nykyinen haitta pienhiukkasista ydinjätteiden rasitus tuleville sukupolville? ydinasevaara

39
Kulutustottumukset Hiilidioksidipäästöt 10 km matkalla ilmasto.org
Lähde: Liikennevälineiden yksikköpäästöt ilmasto.org 24

40
Jokaisella ihmisellä yhtäläinen oikeus tuottaa päästöjä?
tonnia hiilidioksidia / asukas Maailman keskiarvo ilmasto.org 9 Lähde: Tilastokeskus 2004

41
Johtopäätökset Fossiilisiin polttoaineiseen perustuvasta energiataloudesta päästävä eroon pienhiukkaset kasvihuoneilmiö Ei yhtä ratkaisua, vaan monen tekijän summa vaikeita eettisiä ratkaisuja tiede ei yksin voi antaa vastausta vaatii ennakkoluulotonta, tarkkaa harkintaa

42
Ilmastonmuutoksen torjunnan keinot Suomessa (SILMU, 1996)
Energiantuotanto -tuotannon tehostaminen (sähkön tuotannon hyötysuhteen nosto, sähkön ja lämmön yhteistuotanto) -energialähteen valinta (fossiiliset vs. uusiutuvat polttoaineet, jätteet) Energian kulutus -säästäminen -energian käytön tehostaminen Liikenne -ominaiskulutuksen pienentäminen -biopolttoaineet -vetypolttoaine -joukkoliikenne (kuormitusasteen nosto) Yhdyskuntarakenne -tiivistäminen -liikennemäärien minimointi Elämäntavat -kulutustapojen muutos
 -energialähteen valinta (fossiiliset vs. uusiutuvat polttoaineet, jätteet) Energian kulutus. -säästäminen. -energian käytön tehostaminen. Liikenne. -ominaiskulutuksen pienentäminen. -biopolttoaineet. -vetypolttoaine. -joukkoliikenne (kuormitusasteen nosto) Yhdyskuntarakenne. -tiivistäminen. -liikennemäärien minimointi. Elämäntavat. -kulutustapojen muutos.")
Samankaltaiset esitykset